
Stock Analysis

Pull real-world stock data like NVIDIA and Microsoft from Yahoo Finance, compare performance over time, and turn raw prices into research-grade insights using Agent Zero and its code-execution tool.
Overview
Agent Zero turns equity and ETF market data into a live, interactive research lab. Using the built-in code-execution tool, you can pull historical and intraday prices from sources like Yahoo Finance or broker APIs, normalize feeds, and compare tickers side by side in a single, reproducible workspace.
Whether you're analyzing NVIDIA (NVDA) and Microsoft (MSFT), researching systematic equity strategies, or monitoring a diversified portfolio, Agent Zero helps you fetch data, build charts, test ideas, and document your entire workflow with clear, explainable steps.
Common Tasks
Real-Time Market Data & Multi-Exchange Monitoring
Build live views of market data without wiring everything by hand:
- Connect to data sources like Yahoo Finance, broker APIs, and exchange feeds for stocks, ETFs, and other assets
- Track tickers like NVDA, MSFT, and SPY across multiple data sources in real time
- Normalize symbols, quote currencies, and timezones into a single data model
- Compute spreads, slippage, and effective prices across venues
- Visualize price, volume, and spreads on unified dashboards
Example:
You: "Stream intraday prices for NVIDIA (NVDA) and Microsoft (MSFT), overlay them with QQQ as a benchmark, and highlight whenever NVIDIA underperforms Microsoft by more than 1% over the last hour."
Agent Zero will use the code-execution tool to call Yahoo Finance or broker APIs, align timestamps, compute relative performance, and render a live chart that surfaces trade-worthy divergences at a glance.
Strategy Research & Backtesting
Quickly test trading ideas before risking capital:
- Download historical OHLCV data for stocks, ETFs, indices, and optionally crypto pairs
- Implement technical indicators in Python (moving averages, RSI, Bollinger Bands, and more)
- Backtest entry/exit rules on years of price history
- Measure returns, drawdowns, hit rate, and risk-adjusted performance
- Compare strategies across assets, timeframes, and exchanges
Portfolio & Risk Analytics
Understand how positions behave together instead of in isolation:
- Aggregate positions and P&L across multiple brokers or exchanges
- Calculate correlations between stocks, ETFs, indices, and (if relevant) crypto assets
- Estimate volatility and simple risk metrics over custom windows
- Simulate what-if scenarios and stress tests on your portfolio
- Generate allocation and performance breakdowns by asset, sector, or exchange
Automation, Reporting & Documentation
Turn repeatable workflows into reusable tools:
- Package analysis steps into reusable Python scripts or notebooks via the code-execution tool
- Schedule recurring analyses for daily or intraday market close
- Export tables and charts for slide decks, investor updates, or research notes
- Log parameters and results for every run to keep a full audit trail
- Document your process so future you—or your team—can reproduce every insight
Getting Started
Working with markets in Agent Zero is conversational: you describe the assets, exchanges, and horizon you care about, and Agent Zero wires up the code, APIs, and charts for you.
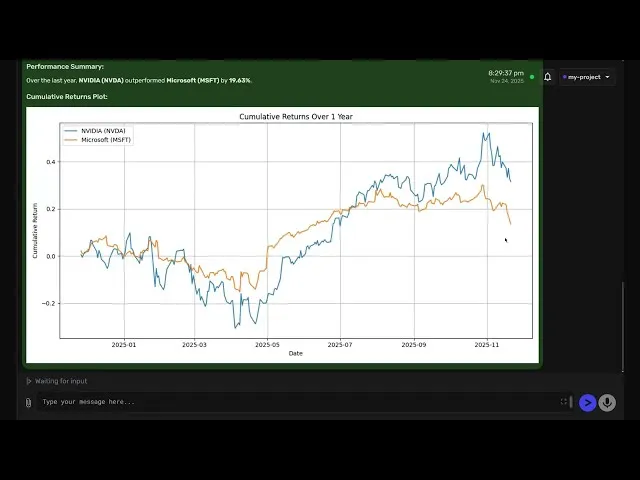
NVIDIA & Microsoft Real-World Demo:
"Hi Agent Zero, today I'd like to showcase your capabilities with a real-world example. Use the code_execution_tool with Python to fetch historical stock data for NVIDIA (NVDA) and Microsoft (MSFT) from Yahoo Finance, then plot both price series on one chart and show me the first few rows of each dataset."
Equity Correlation Check:
"Download the last 2 years of daily prices for AAPL, MSFT, and SPY. Plot their normalized performance and calculate rolling 60-day correlations."
Strategy Backtest:
"Backtest a 50/200-day moving-average crossover strategy on NVIDIA (NVDA) using daily data from Yahoo Finance for the last 5 years. Show returns, maximum drawdown, and a simple equity curve."
Agent Zero will handle data access, transformation, calculations, and visualizations in the code-execution environment, while clearly explaining each step so you can trust and refine the logic.
Why Use Agent Zero for Stock Analysis?
- Code + Conversation: Combine natural language with executable Python code in one workspace
- Exchange-Agnostic: Work with data from multiple brokers and exchanges without rewriting everything
- Faster Iteration: Test new trading ideas in minutes instead of hours of manual scripting
- Transparent Workflows: See every line of code used to fetch, clean, and analyze your market data
- Flexible Across Assets: Analyze stocks, ETFs, futures, and crypto assets using the same tools
- Reproducible Research: Rerun the exact same analysis whenever markets change or new data arrives
- Professional Output: Generate charts, tables, and reports suitable for teams, clients, or investors
Real-World Scenarios
Scenario: NVIDIA & Microsoft Intraday Tracking
You: "Track intraday prices for NVIDIA (NVDA) and Microsoft (MSFT), log prices every few minutes, plot them together, and alert me whenever their performance diverges by more than 1% over the last hour."
Agent Zero will use the code-execution tool to call Yahoo Finance or broker APIs, store time series data, calculate relative performance, and generate visualizations that surface divergences you can react to quickly.
Scenario: Systematic Stock Strategy Research
You: "Backtest a momentum strategy on a basket of large-cap stocks. Use daily data for the last 5 years, rebalance monthly, and compare the strategy to a buy-and-hold SPY benchmark."
Agent Zero will download the required price history, implement your ranking and rebalancing rules in code, simulate the portfolio over time, and present performance metrics and charts that make the results easy to interpret.
Scenario: Portfolio Monitoring & Risk
You: "Given my current holdings in NVDA, MSFT, AAPL, and QQQ, pull the latest prices, estimate daily volatility, and show me how much I could lose in a typical bad day based on recent history."
Agent Zero will fetch up-to-date prices, compute simple risk metrics like volatility and historical drawdowns, and summarize your portfolio exposure so you can adjust allocations with confidence.
Next Steps
Ready to level up your stock and crypto analysis? Get started with Agent Zero and build your first multi-exchange dashboard or backtest.